DS 520 Assignment Week 8
8.40 Teeth and military service.
In 1898 the United States and Spain fought a war over the U.S. intervention in the Cuban War of
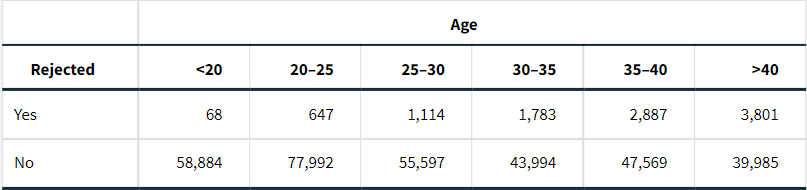
Independence. At that time the U.S. military was concerned about the nutrition of its recruits. Many did not have a sufficient number of teeth to chew the food provided to soldiers. As a result, it was likely that they would be undernourished and unable to fulfill their duties as soldiers. The requirements at that time specified that a recruit must have “at least four sound double teeth, one above and one below on each side of the mouth, and so opposed” so that they could chew food. Of the 58,952 recruits who were under the age of 20,68 were rejected for this reason. For the 43,786 recruits who were 40 or over, 3801 were rejected.
(a) Find the proportion of rejects for each age group.
Solution
The proportion of rejects for the group who are under the age of 20:
From the information, the number of persons rejected who were under the age of 20 is 68. That is,?x1?=68.
The number of persons recruited who were under the age of 20 is 58,952. That is,?n1?=58,952.
The proportion of rejects is,
p?1= ??
Therefore, ? the proportion of rejects for the group who are under the age of 20 is 0.0012.
The proportion of rejects for the group who are under the age of 40:
From the information, the number of persons rejected who is the age of 40 or over is 3,801. That is,
x2 = 3,801
The number of persons recruited who were the age of 40 or over is 43,786. That is,
n2 = 43,786
The proportion of rejects is:
p?2= ?
The proportion of rejects for the group who is the age of 40 or over is 0.0868
(b) Find a 99% confidence interval for the difference in the proportions.
Solution
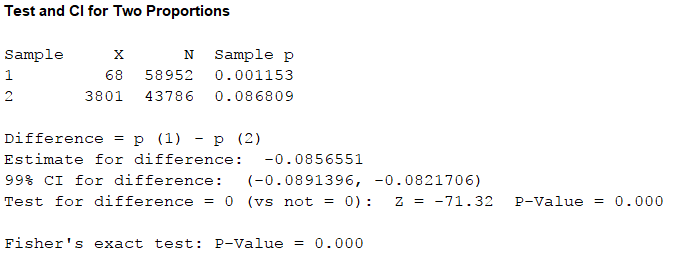
From the MINITAB output the 99% confidence interval for the difference in the proportions is?(?0.0891, ?0.0822).
Therefore, the 99% confidence interval for the difference in the proportions is (?0.0891, ?0.0822)
(c) Use a significance test to compare the proportions. Write a short paragraph describing your results and conclusions.
Solution
H0: p1=p2
H1: p1≠p2
SE=
Z=
P-value = 0.0000<0.01, therefore, we reject H0
We have evidence to conclude that there was difference in the proportion of rejects for the two groups.
(d) Are the guidelines for the use of the large-sample approach satisfied for your work in part (b) and (c)? Explain your answers.
Solution
Sample sizes used
58,952 (for recruits under the age of 20)
Rejected recruits = 68
43,786 (recruits who were 40 or over)
Rejected recruits= 3801
Therefore, I would say that the guidelines for the use of the large-sample approach are satisfied for the work in parts (b) and (c) because the samples are random, large enough, and the rejects are greater than 10.
9.39 Health care fraud
Most errors in billing insurance providers for health care services involve honest mistakes by
patients, physicians, or others involved in the health care system. However, fraud is a serious
problem. The National Health Care Anti-fraud Association estimates that approximately tens of billion is lost to health care fraud each year. When fraud is suspected, an audit of randomly selected billings is often conducted. The selected claims are then reviewed by experts, and each claim is classified as allowed or not allowed. The distributions of the amounts of claims are frequently highly skewed, with a large number of small claims and a small number of large claims. Since simple random sampling would likely be overwhelmed by small claims and would tend to miss the large claims, stratification is often used. See the section on stratified sampling in Chapter 3.
Here are data from an audit that used three strata based on the sizes of the claims (small, medium, and large):
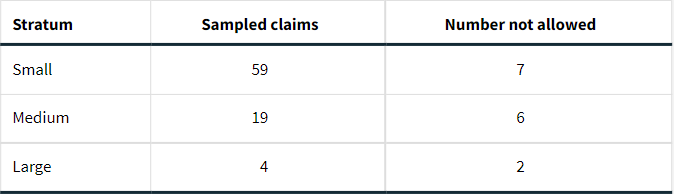
(a) Construct the 3 × 2 table of counts for these data that includes the marginal totals.
Solution
b. Find the percent of claims that were not allowed in each of the three strata.
Solution
Percent of claims not allowed:
Large =
Medium =
Small =
c. State an appropriate null hypothesis to be tested for these data.
Solution
H0: Claims are independent of three stratum
H1: Claims are dependent of three stratum
d. Perform the significance test and report your test statistic with degrees of freedom and the P-value. State your conclusion.
Solution
Using excel calculations, the p-value was found to be 0.04.
Since the p-value is < α (that is, 0.04<0.05, then we reject the null hypothesis.
Therefore, the claims are dependent of the three stratum.
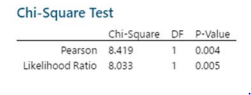
As seen above, the degree of freedom was found to be 1
e. Is there a reason you should not trust the chi-square test for this setting? Explain your answer.
Solution
Yes. There is a reason why we should not trust the chi-square test for this setting. The reason is that chi-square is sensitive to smaller frequencies of contingency. It is very sensitive to sample size as with increase in sample size, absolute difference reduces compared to expected value. Here we can see that quite a few cells have values less than 5 (which is quite small). Chi-square also assumes random sampling and not stratified so that must also be another cause not to trust it completely.
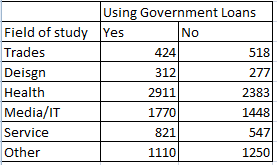
9.31 When do Canadian students enter private career colleges?
A survey of 13,364 Canadian students who enrolled in private career colleges was conducted to
understand student participation in the private postsecondary educational system. In one part of the survey, students were asked about their field of study and about when they entered college.
Results Attached : CANF
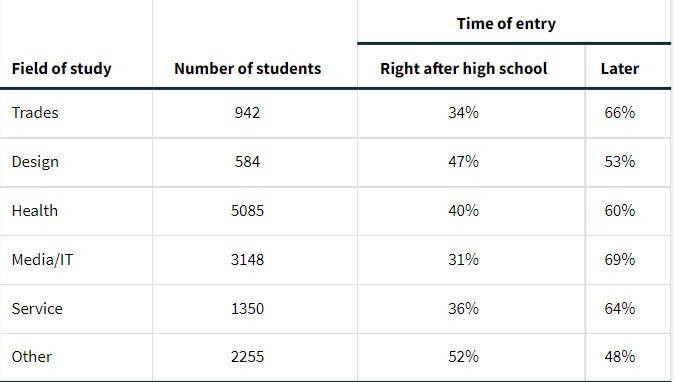
In the table, the second column gives the number of students in each field of study. The next two columns give the marginal distribution of time of entry for each field of study.
(a) Use the data provided to make the 6 × 2 table of counts for this problem.
Solution
(b) Analyze the data.
Solution
State the hypotheses.?
H0: The number students using government loans to finance their education and their field of study are independent.
Ha: The number students using government loans to finance their education and their field of study are not independent.
Formulate an analysis plan. For this analysis, the significance level is 0.01. Using sample data, we will conduct a chi-square test for independence.
Analyze sample data. Applying the chi-square test for independence to sample data, we compute the degrees of freedom, the expected frequency counts, and the chi-square test statistic. Based on the chi-square statistic and the degrees of freedom, we determine the P-value.
DF = (r - 1) * (c - 1) = (2 - 1) * (6 - 1) = 5
Er,c?= (nr?* nc) / n
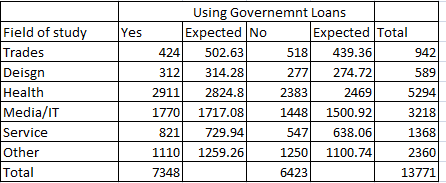
Χ2?= Σ [ (Or,c?- Er,c)2?/ Er,c?]
Χ2?= 12.303 + 14.074 + 0.017 + 0.019 + 2.630 + 3.009 + 1.631 + 1.866 + 11.359 + 12.994 + 17.692 + 20.240
= 97.83
where DF is the degrees of freedom, nc is the number of observations from level c , n is the number of observations in the sample, Er,c is the expected frequency count, and Or,c is the observed frequency count.
The P-value is the probability that a chi-square statistic having 5 degrees of freedom is more extreme than 97.83
We use the Chi-Square Distribution Calculator to find P(Χ2 > 97.83) = 0.00001
Since the P-value (0.00001) is less than the significance level (0.01), we cannot accept the null hypothesis.
(c) Write a summary of your conclusions. Be sure to include the results of your significance testing as well as a graphical summary.
We have sufficient evidence to conclude that there is an association between field of study and taking government loans.
9.50 Goodness of fit to a standard Normal distribution
Computer software generated 300 random numbers that should look as if they are from the standard Normal distribution. They are categorized into five groups: (1) less than or equal to ?0.7, (2) greater than ?0.7 and less than or equal to ?0.3, (3) greater than ?0.3 and less than or equal to 0.3, (4) greater than 0.3 and less than or equal to 0.7, and (5) greater than 0.7. The counts in the five groups are 73, 39, 82, 49, and 57, respectively. Find the probabilities for these five intervals using Table A. Then compute the expected number for each interval for a sample of 300. Finally, perform the goodness-of-fit test and summarize your results.
Solution
Probabilities for these Five Intervals
P(X < -0.7) = NORM.S.DIST(-0.7, 1) =?0.2420
P(-0.7 < X < -0.3) = P(z < -0.3) - P(z < -0.7) = NORM.S.DIST(-0.3, 1) - NORM.S.DIST(-0.7, 1) =?0.1401
P(-0.3 < X < 0.3) = P(z < 0.3) - P(z < -0.3) = NORM.S.DIST(0.3, 1) - NORM.S.DIST(-0.3, 1) =?0.2358
P(0.3 < X < 0.7) = P(z < 0.7) - P(z < 0.3) = NORM.S.DIST(0.7, 1) - NORM.S.DIST(0.3, 1) =?0.1401
P(X > 0.7) = 1 - P(z < 0.7) = 1 - NORM.S.DIST(0.7, 1) =?0.2420
The expected number for each interval for a sample of 300
The goodness-of-fit test and summary of results
Since there are 5 groups, the probability is 1/5 = 0.2
Since there are 300 numbers generated, expected counts are 300(0.2) = 500/5 = 60
χ? = ∑ ((O-E)?/E) = 6.52
degrees of freedom, df = n-1 = 4
There are 4 degrees of freedom here, so the p-value is 0.3041.
Conclusion: Since the p-value is high, that is, (0.3041>0.05), we fail to reject the null hypothesis. So we can conclude that the random numbers are uniformly distributed among the 5 groups.
9.1 Eight is enough.
A healthy body needs good food, and healthy teeth are needed to chew our food so that it can nourish our bodies. The U.S. Army has recognized this fact and requires recruits to pass a dental examination. If you wanted to be a soldier in the Spanish American War, which took place in 1898, you needed to have at least eight teeth. Here is the statement of the requirement:
Unless an applicant has at least four sound double teeth, one above and one below on each side of the mouth, and so opposed as to serve the purpose of mastication, he should be rejected.
A study reported the rejection data for enlistment candidates classified by age. Here are the data:
Which variable is the explanatory variable? Which variable is the response variable? Give reasons for your answer.
Solution
The age of the applicants here is the explanatory variable and the choice of rejection (Yes or No) is the response because age is the governing factor behind the appropriate number of teeth that the candidate possesses. Based on the age, the criteria for proper teeth is studied, the appropriate choice of rejection is made and the response is noted.
Find the joint distribution. Write a brief summary explaining the major features of this distribution.
Solution
The joint distribution is found by dividing the count of each cell by the total number of observations which is 334321.
Hence the joint distribution is as shown below:
Expressing the joint densities as percentages by multiplying by 100, we get:
Now it is clear to infer from the table that candidates aged between 20 and 25 have the least chances of rejection. That is, 23.32848% of them are not rejected. The chances of being rejected when aged above 40 is the most. That is, 1.136931%. Hence an important observation is that as age of the application increases, the chances of rejection increases.
Find the two marginal distributions. Write a brief summary explaining the major features of these distributions.
Solution
The marginal distributions are obtained as summing over the respective rows and columns.
The row totals indicate that of all applicants about 96.91913% of them are not rejected. On the other hand, the column totals indicate that the most applicants are received in the age group of 20-25, that is about 23.522%.
Find conditional distributions and give a brief summary explaining the major features of these distributions.
Solution
The conditional distribution is obtained by fixing each column and dividing each cell in the column by the respective column total.
From this table, the conditional table thus obtained is:
Each cell in the conditional distribution table refers to the chances of being rejected or not rejected provided the candidate is from a specified age group.
